Roadmap To Profitability™ Dashboard
Using Our Proprietary Technologies to Give
You a Competitive Advantage
Taylor Business Group is pleased to offer the Roadmap To Profitability™ Financial Dashboard, a revolutionary way of looking at your financials.
You no longer need to be baffled at what your income statement or balance sheet is telling you. The Roadmap To Profitability™ Financial Dashboard will display in graphical terms how each segment of your company is performing by comparing your results to the Taylor Business Group’s industry leading performance benchmarks.
This is an online service. You simply upload your chart of accounts, income statement and balance sheet in a CSV format to a secure location on our website and these reports are automatically generated for you. You choose the time period(s) for the reports.
Roadmap To Profitability™
Income Statement Dashboard
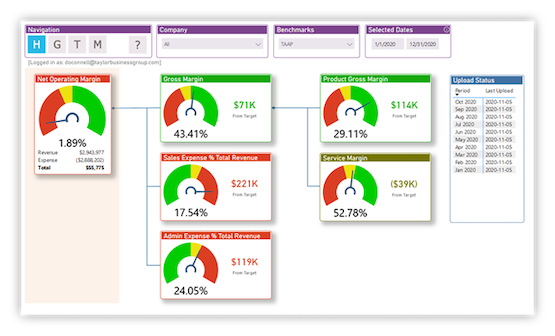
Through the use of gauges, you will be able to determine if you are not meeting the benchmarks (in the red), close but not at the benchmarks (in the yellow) or exceeding the benchmarks (in the green).
This first page is an overall snapshot of your income statement for the period you have selected. You can drill down into the details of each segment of your business by clicking any of the other tabs (Products, Services, Recurring, Non-recurring, Sales or Admin).
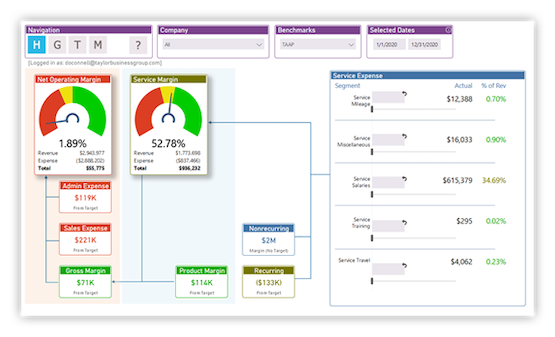
When you click one of those tabs a detail of that part of your business appears.
On any of those tabs (Services was chosen as seen above), you can view your financial performance in detail for that part of your business. Note that on some of the displays there is a blue ball. This is a slider that will allow you to adjust the values of an item.
For example, on the page above you see that Service Salaries is in the red. You can move the blue ball slider to the left to see the overall effect of reducing the salaries (until it turns green) for your service department’s profitability and the effect on the overall company’s profitability (see the gauge in the far upper right hand corner). This feature allows you to play the ‘what if” game with any of your numbers.
Roadmap To Profitability™
Trending Dashboard
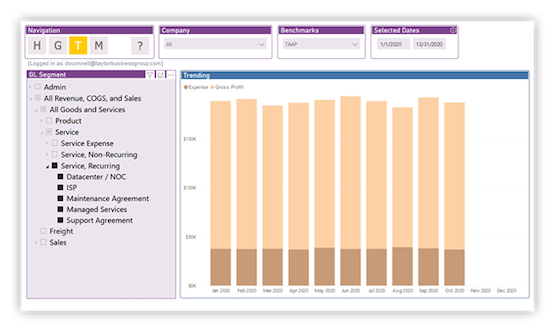
The final aspect of the Roadmap To Profitability™ Financial Dashboard is trending. In essence, how are the components of your business performing over time. Up to 24 months of data can be accumulated for the trends.
There are 6 basic areas of trending:
- Product
- Service Revenues
- Service Gross Profit
- Sales Expense
- Administration
- Net Operating Income
Now you can look over multiple time periods at how you are improving your business, and, at the pace you are going, project what your business is will produce in all of the categories just listed.
Roadmap To Profitability™ Video Training Vignettes
High Level Overview
RTP 2.0
Product Gross Margin
RTP 2.0
Service Margin
RTP 2.0
Sales and Admin Expense
RTP 2.0
Gap Analysis Report
RTP 2.0
Mapping Report
RTP 2.0
Balance Sheet
RTP 2.0
If you would like to speak with someone directly about Taylor Business Group’s Roadmap To Profitability™ Financial Dashboard, or would like a demonstration, please contact Jeff Razafsky at (331) 251-1279, or email Jeff at jeff@taylorbusinessgroup.com.
Ready to Accelerate Your Profitability?
TBG will bring years of management experience to your company. We can assist in areas of management coaching pertaining to your sales, service, or administrative departments. Our focus is to assist you in driving more profits to your bottom line.
Contact Us (630) 442-1402